So I guess you're wondering why this is called the Cape Town Carbon Observatory blog, when I've been going on about Kruger the whole time. Well, about a year and a half after completing my Masters, I needed to get a move on with starting my PhD. The questions about when I was starting and what I was going to do were starting to become persistent. I knew that I wanted to do something in carbon science, and was always convinced that it would be centred around the flux tower data, but then a proposal landed up in my inbox that my supervisor was leading, and a large focus of the proposal was on estimating carbon fluxes over a large region, but this time using different technology and science than what I had been working with.
The proposal needed a bit of extra back ground, so I searched up "inverse modelling", and discovered words like "Bayesian" and "Covariance Matrix" which were right up my alley. I discovered that this was the method used to get the estimates published by the IPCC (Intergovernmental Panel on Climate Change
http://www.ipcc.ch/). Global estimates are derived from hundreds of stations around the world ... but they're not so evening distributed. And so I started my PhD journey.
If you have a look below the equator line, you'll notice that the stations become a little sparse. Particularly the ones on land. So when the IPCC is giving estimates of regional carbon dioxide emissions, and they start talking about Africa, or sub-Saharan Africa, they're basing their estimates on observations that are available at only a handful of stations (and some pretty sophisticated atmospheric transport models). The Cape Point station right on the tip of Africa is probably one of the oldest stations on the continent, whereas the Namibian station is one of the most recent stations.
The goal of the proposed project was to increase the capacity to collect these sorts of measurements in South Africa, and ultimately to be able to increase the density of the network in South Africa. The intention is also not just to become a data provider to the scientific community, but to actively engage with the data, and be able to generate our own regional estimates from the atmospheric measurements.
Since the expertise already existed around the Cape Point Station, and from our group's experience with working with scientific technology, we knew that it would be crazy to try this on our own, we decided to focus in on Cape Town. Scientific measurement equipment rarely comes all neatly packaged in a box, which when opened, automatically deploys itself and works faultlessly for the rest of your days. If only it were so simple. Setting up the monitoring sites and getting the best possible measurements would be a challenge, but fortunately the team at the Cape Point Global Atmospheric Watch station were on hand to assist.
 |
| The Cape Point Global Atmospheric Watch Station |
We strategically decided to start our first two monitoring sites on the borders of the City of Cape Town, so that we could take advantage of the existing measurements at Cape Point, and the fortuitous location of the Robben Island and Hangklip lighthouses, to get information about the emissions from the City of Cape Town. Why lighthouses? Well, they're pretty tall buildings, they have power (and its important that they always have power or else there would be ships crashing all over the place), and they provide a fairly weather proof environment for the monitoring equipment to live.
 |
| A map of the Western Cape region in South Africa, with the yellow markers pointing out the Cape Point measurement station, as well as the new sites at Robben Island and Hangklip. Map generated using Google Earth earth.google.com |
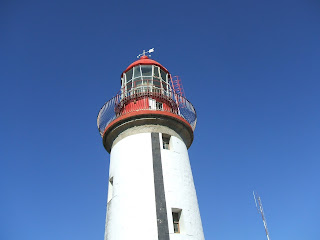 |
| The Robben Island lighthouse - an ideal domicile for the measurement equipment |
And that's how I find myself heading over to a world heritage site on a fairly frequent basis, for reasons other than historical interest, and dangling from the top of very tall lighthouses with the wind blowing at 80hm/h plus (don't tell the health and safety officer - but don't worry - I'm wearing the appropriate PPE) to fiddle with inlet tubes and weather stations.


No comments:
Post a Comment