It's been a while since I've posted. I'm deep in the data analysis and modelling mode now. I've been trying to convert information I have on vehicles which is represented as lines in a shape file to raster data, and had a major success today. I thought I would share this since I could fine no reference to the problem elsewhere. I'm using R to do my GIS manipulations, particularly the packages rgeos, raster and ncdf.
So the problem is: I have line data in a shape file, but I want it as raster data (i.e. represented in pixels). I'm interested in a particular field (in my case the number of vehicles per hour on a road). This data is represented as a line, which has a field for number of vehicles on that road in an hour. There are functions in R which can rasterize data.
So for examples I could use:
rasterize(VehAMPKhrpoll_trans, q, 'Vkmhr', fun = "sum")
where VehAMPKhrpoll is my shape file which I've imported into R and reprojected.
But I found with this function that the sum over all the lines for the field of interest does not equal the sum for this field over all the pixels. This was a major problem for me. The model for the vehicle numbers already has errors, and I didn't want to compound those errors by incorrectly rasterizing my data.
So after a few days of hacking away at R code I managed to come up with this function which uses the extent from a NETCDF file which has the extent I require, and then rasterizes the line data from my shape file, by cropping the lines within a particular pixel, then extracting the lengths of each line in the pixel, then dividing the length of that line by the original length of the line to get the proportion of the line inside the pixel, and then multiplying the field for that line (i.e. number of vehicles) by the proportion, so that the value of the field for that line inside the pixel is proportional to how much of the line is in the pixel. And in this way, if I sum over all my pixels, I obtain the sum over all my lines for that particular field of interest.
The R function I used is:
## filename1 = file name and/or location of NETCDF file
## filename2 = file name and/or location of shape file (just the first part of the file names)
## field = The field of interest in the shape file
## nrow = number of rows in the raster file
## ncol = number of columns in the raster file
rasterize_sum <-function(filename1, filename2, field, nrow, ncol) {
### Function to obtain the sum of lines in a pixel for a particular field, but where the proportional value
### of the field that is allocated to a line inside the pixel is based on the length of the line which falls
### into the pixel.
require(ncdf)
require(rgeos)
require(raster)
#Read in the NETCDF file
ncid_old <- open.ncdf( filename1, write=FALSE )
#Read in the shape file
VehAMPKhrpoll <- readOGR(dsn = getwd(), layer = filename2)
VehAMPKhrpoll_trans <- spTransform(VehAMPKhrpoll, CRS("+proj=longlat +ellps=WGS84 +datum=WGS84 +no_defs"))
#Extract the lon and lat from the NETCDF file
lon <- ncid_old$dim$lon$vals
lat <- ncid_old$dim$lat$vals
## This part is here because the coordinates in a NETCDF file gives the centre value of each pixel
lon_min <- min(lon)-(lon[2]-lon[1])*2^(-1)
lon_max <- max(lon)+(lon[2]-lon[1])*2^(-1)
lat_min <- min(lat)-(lat[2]-lat[1])*2^(-1)
lat_max <- max(lat)+(lat[2]-lat[1])*2^(-1)
space_to_centre_lon <- ((lon_max - lon_min)*ncol^(-1))*2^(-1)
space_to_centre_lat <- ((lat_max - lat_min)*nrow^(-1))*2^(-1)
lon1 <- seq((lon_min + space_to_centre_lon),(lon_max - space_to_centre_lon), length = ncol)
lat1 <- seq((lat_min + space_to_centre_lat),(lat_max - space_to_centre_lat), length = nrow)
## Getting the lengths for each line in the original shape file
BB <- gLength(VehAMPKhrpoll_trans, byid = TRUE)
## A box to get the extent of the NETCDF file
dd <- cbind(x=c(lon_min, lon_min, lon_max, lon_max, lon_min), y=c(lat_min, lat_max, lat_max, lat_min, lat_min))
#Initialising the raster file
Vkmhr_RASTER <- raster(ncol = ncol, nrow = nrow)
extent(Vkmhr_RASTER) <- extent(dd)
# a loop to go through each pixel in the raster file
for (i in 1:length(lon1)) {
for (j in 1:length(lat1)) {
# Obtaining the extent for a pixel
xmin <- lon1[i] - (lon1[2]-lon1[1])/2 ; xmax <- lon1[i] + (lon1[2]-lon1[1])/2; ymin <- lat1[j]- (lat1[2]-lat1[1])/2; ymax <- lat1[j] + (lat1[2]-lat1[1])/2
aa <- cbind(x=c(xmin, xmin, xmax, xmax, xmin), y=c(ymin, ymax, ymax, ymin, ymin))
# cropping the SpatialLinesDataFrame by the current pixel
VEH1 <- crop(VehAMPKhrpoll_trans, extent(aa))
# Initialising a vector which will contain the proportions of each line in the pixel
CC <- NULL
# Initialising a vector which will contain the proportional values of the field of interest
VEHprop <- NULL
#Filling the raster file, from bottom row to top row (lowest lats first)
#Row 1 of the raster file will be for the maximum latitude value
if (is.null(VEH1)) {
values(Vkmhr_RASTER)[(nrow-j)*ncol + i] <- NA
} else {
AA <- gLength(VEH1, byid = TRUE)
for (k in 1:length(names(AA))) {
CC[k] <- AA[names(AA)==names(AA)[k]]/BB[names(BB)==names(AA)[k]]
##BAD BAD hard coded the field value here, need it to be input in function
VEHprop[k] <- VEH1@data[,field][k]*CC[k]
}
values(Vkmhr_RASTER)[(nrow-j)*ncol + i] <- sum(VEHprop, na.rm = TRUE)
}
}
}
Vkmhr_RASTER
}
filename1 <- "ccam_filestructure.nc" ## The NETCDF file
filename2 <- "VehAMPKhrpoll" ## The shape file
Vkmhr_RASTER1 <- rasterize_sum(filename1, filename2, "Vkmhr", 25, 25) ## Be sure to put the field name
## in inverted commas
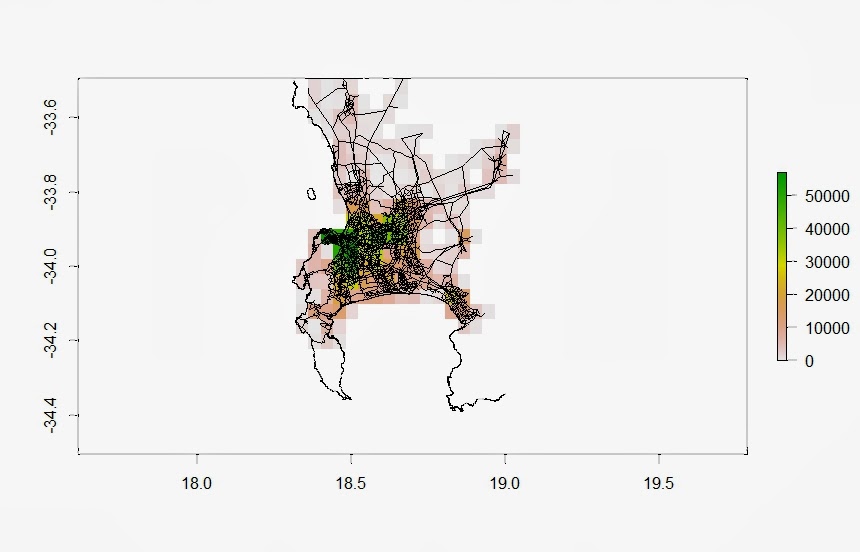 |
| Image of the rasterized shape file lines data for vehicle kilometre numbers on Western Cape roads |
Hopefully this helps someone out there!